I hope you do enjoy this free blog. I only ask one thing from you in return, click in one of the ads

Monday 11 May 2015

How to add a line break to a cell in Excel

Today we are going to show you a little trick but that can be very useful. How to insert a line break in a cell.


There are 2 ways to insert it, depending on the purpose.

What are they? Let's see:

Tuesday 5 May 2015

Another way to count unique values in a range in Excel

Not long ago I wrote an article about how to count the number of unique values in a range. That trick was basically using the SUMPRODUCT and COUNTIF functions. Today we are going to see another way to calculate it.

To understand what we are trying to do it is always best to use an example. We have a list of names in the range A1: A14, which we have called Name_list.


How many of these names are unique? The answer is obviously 11. But how we calculate it? We saw earlier that can be calculated using the SUMPRODUCT and COUNTIF functions, but today I want to show you another way to perform the same calculation, but this time using the FREQUENCY and MATCH functions.


And what formula is that?

Thursday 30 April 2015

An Excel dashboard about the UK general election 2015

Hello Excel-folks, today I want to share with you a nice informative Excel dashboard that I created for the UK general election on May 7th. I focused on the main 7 parties (those ones that appeared on the ITV debate). See how the dashboard looks like in a few screenshots:


Monday 27 April 2015

How to build a Speedometer chart in Excel

Hello, today we will see how to create one of those cool charts in Excel. The Speedometer chart.


And how do we make it? Let's see step-by-step.


Monday 20 April 2015

The Excel dashboard about Real Madrid Tenth Champions League win 2013/14

Hello Excel fans. Today I would like to mix two of my passions. As you all know I love Excel, but I also love football and am a supporter of Real Madrid. Although it is best to have the full story so that everybody understands. My whole family are Atletico Madrid supporters, in fact I was born as an Atletico fan and I remember going to the Vicente Calderon when I was little, but when I was 5 years or so I changed my team and I became a fan of Real. Why? Because my favourite player was playing for Atletico and then he signed for Real, and I followed him.......   Who is he? The incredible Hugo Sanchez. I was so passionate about how he played and his somersaults as goal celebration, and besides, I also played football with the number 9. Anyway, so today I consider myself a fan of Real Madrid but I still have much appreciation to Atletico. So, back to Excel, I have decided to create a small tribute to Real Madrid for the achievement of the Champions League win last year: the Tenth European Cup, and everything will be done in Excel. So even if you are not Real Madrid supporter or do not even like football, check the dashboard and I am sure you will find it interesting.

First let's see how it looks:


Friday 17 April 2015

An alternative to traditional charts in Excel - Sparklines

Hello everyone

Today let's talk about something that Microsoft introduced for Excel 2010: Sparklines!

These geniuses that can make visualisations easier and faster. There are many times we show a lot of charts and we can overload our presentations, and a simple chart (or sparkline in this case) would be sufficient to convey to the listener what you intend to do.


And what are Sparklines?


Sparklines are tiny charts that are aligned to a row of a table of data and help you visualize the data to show a quick visual representation. They are basically in-cell charts.


Monday 13 April 2015

15 functions in Excel for any user - Part 1

Today I will talk about Excel functions, one of the most important tools in Excel. We will create a list of 15 functions not very used but that can be very, very useful at some point. This entry is the 1st of 2 entries. Here it goes!


1. Remove the spaces from a text except single spaces between words


Sometimes the data are cluttered, dirty, with spaces where you do not want to have, right? As one of the most useful ways to help you clean your data is the TRIM function.

This function removes all spaces from a string except for single spaces between words. Let us examine an example.

=TRIM("The     wizard     of     Excel      ") = The wizard of Excel


The function has removed those spaces before, after and in between to leave the text clean and ready for analysis.

Tuesday 7 April 2015

Welcome to Malta - a dashboard in Excel about this beautiful island

Hello everyone. I guess most of you do not know that I live in Malta. I live in this beautiful island since September 2014. To celebrate my adventure and try to convince my friends to come and visit, I have created a dashboard in Excel about the island. The dashboard runs smoothly in Excel 2007, 2010 and 2013. Other versions have not been tested.


And what is a dashboard?

Friday 3 April 2015

How to build a Thermometer chart in Excel

Hello, today we will see how to create one of those nice charts in Excel. The Thermometer chart.


And how do we make it? Let's see step-by-step.

Tuesday 31 March 2015

COUNTIF tips

The COUNTIF function can provide us with very useful information. From a range you can count empty cells, the non-empty cells, or cells with all text. Let us see it with an example.


Monday 30 March 2015

Tutorial about charting in Excel

Here you will find all the explanations for the charts that I've been putting on the blog:

1. Tornado chart

2. Waterfall chart

3. Band chart

4. Thermometer chart

5. Speedometer chart (coming soon)

6. Growing moustache chart (coming soon)

7. Sparklines (coming soon)

8. In-cell horizontal bar chart using REPT function (coming soon)

9.  In-cell vertical bar chart using REPT and CONCATENATE functions (coming soon)

10. Panel chart (coming soon)

Thursday 26 March 2015

Introduction to band charts in Excel

Today I want to talk about creating band charts in Excel. I use them quite a lot as they help the user to a quick understanding of the visualisation without overloading the chart.

So that we all understand, what I intend to show you is a chart like the following:


The band represents the area between the maximum and the minimum for all products for any one year.

It can also be seen that it is a dynamic chart, each time a product is selected one series in the chart change (could be more if you wanted).


To build a band chart like that one we need to follow a few steps. Let's see how.

Sunday 22 March 2015

Selecting a range from many using the CHOOSE function

A while ago I wrote about the how to convert long NESTED IF formulas to a simple formula with the CHOOSE function. Today we are going to see what else we can achieve by using the CHOOSE function.


We can fetch a range from a selection of ranges


How do we do that?

Let's see by looking at one example:

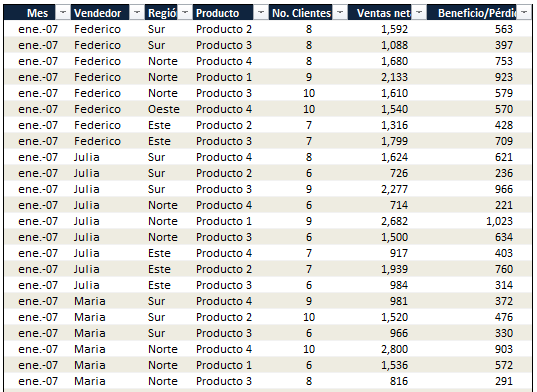
Say that we have 4 ranges, {A1:A10}, {B1:B10}, {C1:C10} and {D1:D10}, and that depending on a condition or a selection by the user we want to use one of them, for example, we want to sum up the range.

=SUM(CHOOSE(2, A1:A10, B1:B10,C1:C10,D1:D10))

Thursday 19 March 2015

5 cool tricks for PivotTables

Today we are going to see 5 super tricks to use when working with PivotTables. With these tricks you will increase the potential of the functionality of our good friends the PivotTables.


1. See which transactions make up a value in the PivotTable


Monday 16 March 2015

How to count the number of unique values in a range in Excel

Hello, on many occasions we have a list or range with lots of data, and we wondered how many of those values or data are unique, and we have had to develop a complex solution by adding helper columns and doing multiple operations.


That is no longer necessary !!


Because we can calculate the number of unique values in a list with a simple formula.

And what formula is that ?? Let's see ...


Thursday 12 March 2015

Array formulas in Excel

What is an array ??


The term array refers to a collection of data residing in a column or row of Excel or a combination of them. In Excel, these elements may reside in a single row (what is called a one-dimensional horizontal array), a column (one-dimensional vertical array ) or multiple rows and columns (two-dimensional array). In Excel you can not create array formulas or arrays that are three-dimensional.

And an array formula ... ??

"I have enough with the formulas, and now you talk about array formulas.. Help!!"

...

If you feel like this right now wait, they are simpler than the name suggests, and learning them it is for Excel power users.

Tuesday 10 March 2015

How to calculate AGE in Excel

Well today I want to look at one of those problems we face from time to time, and that is none other than how to calculate the exact age using Excel, and considering that having to include leap years can present a bigger challenge than we initially anticipated. Well let's see how it's done.

In this tutorial we will look at three methods to calculate age in cell C2, being cell A2 the date of birth and B2 today's date, calculated through the Excel function TODAY.


Thursday 5 March 2015

Conditional Formatting - Formula to search values

Today we are looking at another example of using formulas in conditional formatting.

It is recommended to first read and understand the entrance Conditional Formatting - formulas for selecting cells.

Imagine you have the list of European football teams, located in the range B5:B31.


What we want to achieve is to enter some text in a cell, for example D2, and if that text is in any value from the list then highlight the cell(s) in the way you want.


To do that the formula to be used is:

Conditional Formatting - Formula to highlight duplicates, errors and omissions

Today we are looking at another example of using formulas in conditional formatting.

It is recommended to first read and understand the entrance Conditional Formatting - formulas for selecting cells


1. Highlight duplicates in a list

For this example we will use a standard list of data like this. This list is in the range B7:B23.


So the formula to highlight duplicates is:

=COUNTIF($B$8:$B8,$B8)>1

Tuesday 3 March 2015

How to build a Waterfall chart in Excel

A Waterfall chart???? Yes, in this post we are going to see what I mean by that.

The Waterfall chart in Excel is a type of chart that includes what appears to be floating columns, which help to better visualize the contribution of all parties to the total.


Thursday 26 February 2015

Dependent drop-down lists in Excel

In a recent entry I talked about how to insert drop-down lists in Excel. Today I would like to show you how to insert dependent drop-down lists. Basically what this means is to have 2 or more drop-down lists with the second one having as content a range that depends on the selection made in the first one. Look at the images below:

There is a drop-down list for a list of countries. Depending on the country chosen, the second drop-down list will display the list of cities from that country.


Friday 20 February 2015

Conditional Formatting - Formula to highlight any day(s) of the week

Today we are looking at another example of using formulas in conditional formatting.

It is recommended to first read and understand the entrance Conditional Formatting - formulas for selecting cells

For this example we will use a normal list of days. In my case the list is in the range A1: A15.


Tuesday 17 February 2015

Conditional Formatting - Formula to highlight alternate rows or columns

Here's an example of using conditional formatting formulas.

It is recommended to first read and understand the post Conditional Formatting - formulas for selecting cells


For this example we will use a normal table like this.


As can be clearly seen the table is for Moe's Tavern, and it shows a record of the daily sales.


1. Highlighting alternate rows

Monday 16 February 2015

Conditional Formatting - formulas for selecting cells

An area where more flexibility is allowed in conditional formatting is the use of formulas for selecting which cells that must be formatted. In this section we will see examples of what kind of usages we can have with this option.
  • Formula to highlight alternate rows or columns
  • Formula to highlight specific day of the week
  • Formula to highlight errors, omissions, repetitions
  • Formula to highlight cells that contains a search value
-------------------------------------------------------------------------------------------------------------------------

But first let's see how a formula for conditional formatting is introduced.


1. First you have to go to Conditional Formatting> New Rule


Saturday 14 February 2015

Guide to Conditional Formatting in Excel

Conditional formatting in Excel is a very useful tool for analysing data and made it easy to give a special format to a group of cells based on value of another cell. Among the uses that can provide you is the power to apply a specific font or different fill colour to those cells that meet user-specified rules and thus facilitate their visual identification. Here I present a series of entries for better understanding of the tool.

1. Conditional Formatting - what it is and how to apply

2. Highlighting cells using conditional formatting

3. Formulas for selecting cells


4. Conditional Formatting - Data Bars  (coming soon)

5. Conditional Formatting - Color Scales  (coming soon)

6. Conditional Formatting - Icon Sets  (coming soon)

7- Advanced techniques 1 (coming soon)

8- Advanced techniques 2 (coming soon)

Highlighting cells using conditional formatting

And what kind of effects can conditional formatting do?


1. Highlight cells rules


Operations that may occur;


  • Greater than and/or equal to a value
  • Less than and/or equal to a value
  • Between 2 values
  • Equal to a value
  • Text containing ...
  • A date occurring...
  • Duplicates values

Conditional Formatting in Excel - what it is and how to apply

What is conditional formatting?


Conditional formatting in Excel is a very useful feature in the analysis of data as it empowers you to give a special format to a group of cells according to a condition(s). This format may be a different fill colour or a specific type of font for the cells that meet the established criteria so you can easily identify on the screen.

Although a special format could be given manually, conditional formatting creates an automatic formatting for cells that meet the specified condition, giving the user better visualisations.


Examples of conditional formatting


Thursday 12 February 2015

Highlighting maximum / minimum value of a series in a chart in Excel

Have you ever had a chart and wondered how you could highlight the maximum or minimum value of the series in that Excel chart.

We will discuss exactly that today.


Let's see how we can do it and create a chart like the one below:


Tuesday 10 February 2015

Convert long NESTED IF formulas to a simple formula with the CHOOSE function

Anyone who has used Excel for a while will have found on more than one occasion long formulas that use the IF function inside another IF that in turn is inside another IF. This is normally called NESTED IF.

An easy example of NESTED IF would be:

= IF (B1 = 1, "Apple", IF (B1 = 2, "Orange", IF (B1 = 3 "Pera", "Grape")))


Obviously instead of the name of the fruits we could write a formula, or a cell.

= IF (B1 = 1, A1, IF (B1 = 2, A1-C1, IF (B1 = 3, A1 * D1, A1 ^ 2)))

Saturday 7 February 2015

How to build a Tornado chart in Excel

Hello! In this post I want to explain step by step how to build tornado chart in Excel. If you are a little confused about what a tornado chart is then let me show you visually. Basically a tornado chart looks like this (the typical graph of population distribution by age):


Thursday 5 February 2015

Drop-down lists in Excel

The drop-down list in Excel is a powerful tool that simplifies the process of choosing values ​​for the user. It is a technique widely used in which we can create lists that have the source data located on another sheet in Excel, which are hidden from the main sheet.

In this post we will look at two ways to create a drop-down list, first using data validation and then using the form control option.


1. Drop-down list with data validation

Tuesday 3 February 2015

Guide to PivotTables in Excel

PivotTables are a very powerful tool to analyse data stored in Excel. In this tutorial we will see all the basics of PivotTables.

To enjoy the full tutorial is advisable to download the following file containing all the examples that are used.

PivotTables
------------------------------------------------------------------------------------------------------------------------


1. What are the PivotTables?

2. How to create a PivotTable

3. Formatting a PivotTable

4. Filtering PivotTables

5. Five cool tricks to PivotTables (coming soon)

6. Advanced Techniques for PivotTables (coming soon)

      1. Able to create monthly, quarterly and annual reports from daily data.
      2. Use the filter reports and generate multiple reports
      3. Slicers in PivotTables

Filtering PivotTables

Let's see how PivotTables are filtered


There are 2 possibilities to filter PivotTables:


1. Filter on a value of a variable that has been selected in the Filter field


In our previous example (I recommend reading this post), we had the following:

Formatting a PivotTable

And how do we format a PivotTable?

Let's suppose that we have the following PivotTable (I recommend you check this post):


Now we will format this report a bit.

What are PivotTables?

PivotTables in Excel are a powerful tool that helps us to conduct a thorough analysis of our data, making it quite easy for you to slice and dice, filter, sort and group information in the dynamic table according to our needs.

Basically they are a type of table that allow us to decide which variables appear as columns, as rows and as values ​​in the table and allow you to modify the structure quickly.


What are PivotTables for?

How to create a PivotTable

Let's see how to create a PivotTable


1. Imagine you have some sales data by salesperson, product and region. Make sure that the data has all column headers or table headers and that there are no blank rows .


2. Click any cell in the range of cells or table.

Wednesday 21 January 2015

MIN function

Category: Statistical functions


What does this function do?


Returns the minimum value in a list of values. Ignores logical values and text.


Syntax:


MIN(number1,number2,...)
  • number1 (required): The first of the values or ranges to evaluate.
  • number2 (optional): From the second number or range parameters are optional.

Examples:


=MIN(1, 2, 3) = 1
=MIN(A1:A2,B1:B2) = 1, if A1:A2= {1,2} and B1:B2= {2,3}

MAX function

Category: Statistical functions


What does this function do?


Returns the maximum value in a list of values. Ignores logical values and text.


Syntax:


MAX(number1,number2,...)
  • number1 (required): The first of the values or ranges to evaluate.
  • number2 (optional): From the second number or range parameters are optional.

Examples:


=MAX(1, 2, 3) = 3
=MAX(A1:A2,B1:B2) = 3, if A1:A2= {1,2} and B1:B2= {2,3}

Statistical Functions

The Statistical Functions are used in Excel to perform statistical operations. Take a look at some of the most common functions.

AVERAGE - Returns the average (arithmetic mean) of the arguments, which can be numbers, names, arrays, or references that contain numbers.

COUNT - Count the number of cells in a range that contain numbers.

COUNTA - Count the number of cells in a range that are not empty.

COUNTBLANK - Count the number of cells in a range that are empty.

COUNTIF - Count the cells in a range that meet a specified condition.

COUNTIFS- Count the cells in a range that meet one or more specified conditions.

FREQUENCY - Calculate the frequency of occurrence of a value within a range of values and returns a vertical array of numbers.

LARGE - Returns the largest k-th value of a data set.

MAX - Returns the maximum value in a list of values. Ignores logical values and text.

MEDIAN - Returns the median of a data set.

MIN - Returns the minimum value in a list of values. Ignores logical values and text.

MODE.SNGL - Returns the most frequent or repetitive value of an array or range of data.

RANK.EQ - Returns the rank of a number in a list of numbers: its size relative to other values in the list; if more than one value has the same hierarchy, the top hierarchy of the set of values is returned.

SMALL - Returns the smallest k-th value of a data set.

FREQUENCY function

Category: Statistical functions

What does this function do?


Count the cells in a range that meet one or more specified conditions.


Syntax:


FREQUENCY(data_array, bins_array)

  • data_array (required):An array of or reference to a set of values for which you want to count frequencies. If data_array contains no values, FREQUENCY returns an array of zeros.
  • bins_array (required): An array of or reference to intervals into which you want to group the values in data_array. If bins_array contains no values, FREQUENCY returns the number of elements in data_array.


Examples:


=FREQUENCY(A1:A6,B1:B3) = {0, 1, 2, 3}, if A1:A6 = {11; 20; 21; 30; 29; 29} and B1:B3 = {10; 17; 23}. This means that the number of values equal to 10 or less is 0, the number of values in the interval 11 to 17 is 1, the number of values in the interval 18 to 23 is 2 and the number of values greater than 23 are 3.


COUNTIFS function

Category: Statistical functions


What does this function do?


Count the cells in a range that meet one or more specified conditions.


Syntax:


COUNTIFS(criteria_range1, criteria1, [criteria_range2, criteria2]…)

  • criteria_range1 (required): The first range in which to evaluate the associated criteria.
  • criteria1 (required): The criteria in the form of a number, expression, cell reference, or text that define which cells will be counted. For example, criteria can be expressed as 32, ">32", B4, "apples", or "32".
  • criteria_range2, criteria2, ...(optional): Additional ranges and their associated criteria. Up to 127 range/criteria pairs are allowed.


Examples:


=COUNTIFS(A1:A3, “>1″) = 2 if A1:A3={1,2,3}
=COUNTIFS(B1:B5,1,A1:A5,”>1″) = 1 if B1:B5 ={1;0;0;1;1} and A1:A5 ={0;2;3;4;4}

COUNTA function

Category: Statistical functions


What does this function do?


Count the number of cells in a range that are not empty.


Syntax:


COUNTA(value1, [value2], ...)

  • value1 (required): The first argument representing the values that you want to count.
  • value2 (optional): Additional arguments representing the values that you want to count, up to a maximum of 255 arguments.

Examples:


=COUNTA(A1:A3,B1) = 3 if A1:A3 = {2,””,4} and B1=3

COUNTBLANK function

Category: Statistical functions


What does this function do?


Count the number of cells in a range that are empty.


Syntax:


COUNTBLANK(value1, [value2], ...)

  • value1 (required): The first argument representing the values that you want to count.
  • value2 (optional): Additional arguments representing the values that you want to count, up to a maximum of 255 arguments.

Examples:


=COUNTBLANK(A1:A3,B1) = 3 if A1:A3 = {2,””,4} and B1=1