Showing posts with label PivotTables. Show all posts
Showing posts with label PivotTables. Show all posts
Thursday, 19 March 2015
5 cool tricks for PivotTables
Today we are going to see 5 super tricks to use when working with PivotTables. With these tricks you will increase the potential of the functionality of our good friends the PivotTables.

Tuesday, 3 February 2015
Guide to PivotTables in Excel
PivotTables are a very powerful tool to analyse data stored in Excel. In this tutorial we will see all the basics of PivotTables.
To enjoy the full tutorial is advisable to download the following file containing all the examples that are used.
PivotTables
------------------------------------------------------------------------------------------------------------------------
1. What are the PivotTables?
2. How to create a PivotTable
3. Formatting a PivotTable
4. Filtering PivotTables
5. Five cool tricks to PivotTables (coming soon)
6. Advanced Techniques for PivotTables (coming soon)
1. Able to create monthly, quarterly and annual reports from daily data.
2. Use the filter reports and generate multiple reports
3. Slicers in PivotTables
To enjoy the full tutorial is advisable to download the following file containing all the examples that are used.
PivotTables
------------------------------------------------------------------------------------------------------------------------
1. What are the PivotTables?
2. How to create a PivotTable
3. Formatting a PivotTable
4. Filtering PivotTables
5. Five cool tricks to PivotTables (coming soon)
6. Advanced Techniques for PivotTables (coming soon)
1. Able to create monthly, quarterly and annual reports from daily data.
2. Use the filter reports and generate multiple reports
3. Slicers in PivotTables
Filtering PivotTables
Let's see how PivotTables are filtered
There are 2 possibilities to filter PivotTables:
1. Filter on a value of a variable that has been selected in the Filter field
In our previous example (I recommend reading this post), we had the following:
Formatting a PivotTable
And how do we format a PivotTable?
Let's suppose that we have the following PivotTable (I recommend you check this post):

Now we will format this report a bit.
What are PivotTables?
PivotTables in Excel are a powerful tool that helps us to conduct a thorough analysis of our data, making it quite easy for you to slice and dice, filter, sort and group information in the dynamic table according to our needs.
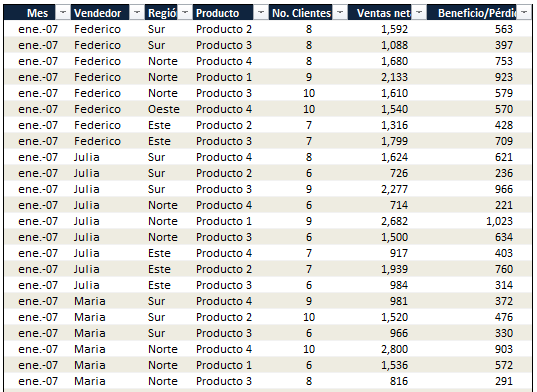
Basically they are a type of table that allow us to decide which variables appear as columns, as rows and as values in the table and allow you to modify the structure quickly.
Basically they are a type of table that allow us to decide which variables appear as columns, as rows and as values in the table and allow you to modify the structure quickly.
What are PivotTables for?
How to create a PivotTable

Subscribe to:
Posts (Atom)