
Showing posts with label Shapes. Show all posts
Showing posts with label Shapes. Show all posts
Thursday, 30 April 2015
An Excel dashboard about the UK general election 2015
Hello Excel-folks, today I want to share with you a nice informative Excel dashboard that I created for the UK general election on May 7th. I focused on the main 7 parties (those ones that appeared on the ITV debate). See how the dashboard looks like in a few screenshots:

Monday, 27 April 2015
How to build a Speedometer chart in Excel
Hello, today we will see how to create one of those cool charts in Excel. The Speedometer chart.
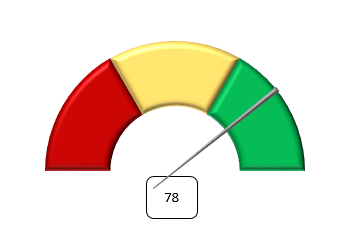
And how do we make it? Let's see step-by-step.
Monday, 20 April 2015
The Excel dashboard about Real Madrid Tenth Champions League win 2013/14
Hello Excel fans. Today I would like to mix two of my passions. As you all know I love Excel, but I also love football and am a supporter of Real Madrid. Although it is best to have the full story so that everybody understands. My whole family are Atletico Madrid supporters, in fact I was born as an Atletico fan and I remember going to the Vicente Calderon when I was little, but when I was 5 years or so I changed my team and I became a fan of Real. Why? Because my favourite player was playing for Atletico and then he signed for Real, and I followed him....... Who is he? The incredible Hugo Sanchez. I was so passionate about how he played and his somersaults as goal celebration, and besides, I also played football with the number 9. Anyway, so today I consider myself a fan of Real Madrid but I still have much appreciation to Atletico. So, back to Excel, I have decided to create a small tribute to Real Madrid for the achievement of the Champions League win last year: the Tenth European Cup, and everything will be done in Excel. So even if you are not Real Madrid supporter or do not even like football, check the dashboard and I am sure you will find it interesting.
First let's see how it looks:

First let's see how it looks:
Friday, 3 April 2015
How to build a Thermometer chart in Excel
Hello, today we will see how to create one of those nice charts in Excel. The Thermometer chart.

And how do we make it? Let's see step-by-step.
Subscribe to:
Posts (Atom)